
A business can have dashboards for revenue, sales, inventory, projects, and finance, yet its leaders may still struggle to explain why an order is delayed or where an approval is stuck. That gap is becoming a serious operational visibility problem. Leaders often see final metrics after performance has changed, while the workflows, handoffs, and decisions behind those metrics remain hidden. As organizations add more teams and systems, visibility depends less on the volume of available data and more on whether that data reflects how work is actually moving.
More Dashboards Do Not Guarantee Operational Visibility
Enterprise reporting has expanded significantly. Most functions now have their own dashboards, analytics tools, and performance indicators. However, these systems often present outcomes rather than the operational conditions producing them.
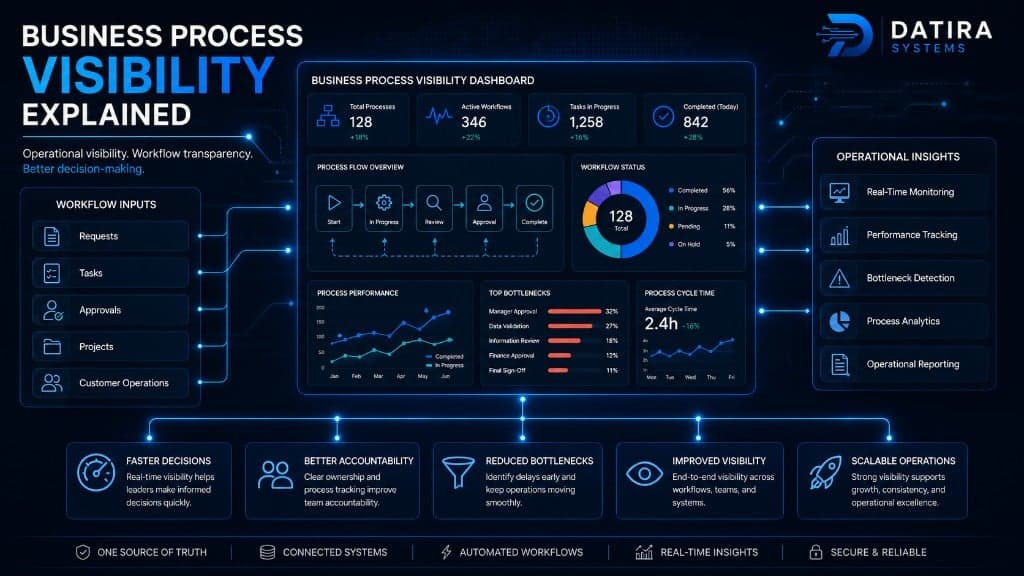
Business process visibility dashboard showing workflows, bottlenecks, and insights (Source: Datira Systems)
A revenue dashboard may show that sales have slowed. It may not reveal that proposals are waiting for approval, customer information is incomplete, or sales teams are working from different versions of the pipeline. Similarly, an inventory report can show declining stock levels without explaining whether the issue began with forecasting, purchasing, warehouse updates, or delayed supplier confirmation.
This difference separates reporting visibility from true business operations visibility. Reporting tells leaders what has already happened. Operational visibility shows what is happening now, where work is slowing down, who owns the next action, and which dependencies may affect the result.
The gap remains significant even in organizations that consider themselves data-driven. According to Salesforce’s latest State of Data and Analytics report, 63% of business leaders describe their organizations as highly data-driven. At the same time, 63% of technical leaders say their companies still struggle to use data to advance business priorities. Half of the business leaders surveyed were also unsure whether they could generate and deliver insights quickly enough.
These findings point to a practical limitation. Access to more metrics does not automatically create better decisions. Leaders need context around those metrics, including workflow status, ownership, exceptions, and the operational events that caused performance to change.
An effective operational dashboard should therefore function as more than a visual reporting layer. It should connect business results with the processes behind them. When a performance indicator changes, leaders should be able to trace the issue back to a real workflow, rather than requesting another report or waiting for several teams to investigate.
Fragmented Workflows Hide the Causes of Operational Problems
Operational blind spots usually form between departments and systems. A process may begin in a CRM, continue through email, move into an ERP, and end with a spreadsheet maintained by another team. Each system may contain accurate information, but no single view reflects the full journey of the work.
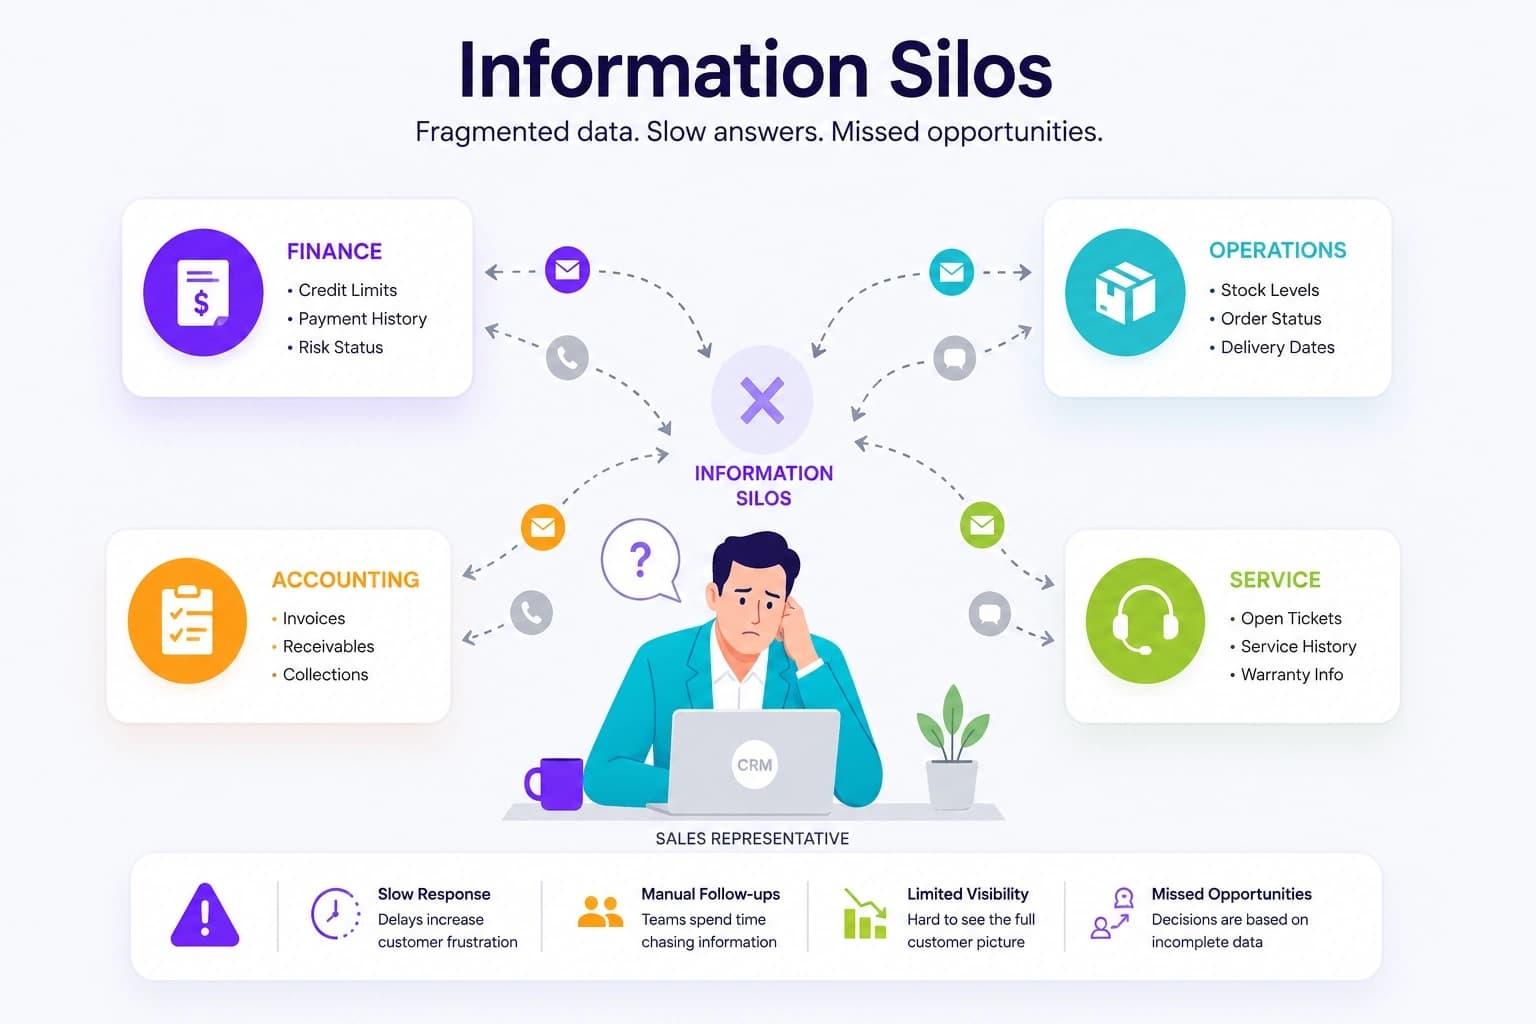
Information silos separating finance, operations, accounting, and service data ( Source: erm)
The scale of this fragmentation is considerable. MuleSoft’s 2025 Connectivity Benchmark Report found that organizations use an average of 897 applications. Yet only 2% have successfully integrated more than half of their applications. When information moves across that many disconnected environments, leaders may receive technically correct reports that still lack operational context.
The problem becomes most visible at handoff points. A sales team may mark a deal as complete before finance receives the required billing details. Procurement may place an order without seeing that a warehouse has updated its demand forecast. A project may appear active while the next owner is unclear. These gaps rarely appear as a single system error. Instead, they create delays, repeated follow-ups, and inconsistent reporting across departments.
The cost also appears in employees’ daily work. Asana’s State of Work Innovation research, based on more than 13,000 knowledge workers, found that 53% of working time is spent on activities such as communicating about work, searching for information, and chasing task updates. Only 12% of respondents said new information moves quickly between departments.
Communication volume can hide the problem rather than solve it. Microsoft’s 2025 Work Trend Index reported that employees in the highest-volume group of Microsoft 365 users received up to 275 interruptions per day from meetings, emails, and chats. Frequent updates may create the impression that work is visible. In practice, they often indicate that employees must manually reconstruct information that their systems do not provide clearly.
For leaders, this creates a distorted operational picture. A process may appear healthy because every department has reported its own progress. However, no one can see the accumulated waiting time between those departments. A delayed approval, incomplete record, or missed dependency can remain invisible until it affects a customer, deadline, or financial result.
Improving workflow visibility requires organizations to look beyond individual tools. The full process must be mapped across teams, systems, and decision points. Leaders need to see where work enters a workflow, how it changes, where it waits, and what action should happen next.
Operational Visibility Must Be Built Around Decisions
Many organizations approach visibility by adding another business intelligence tool. While better analytics can improve access to information, the deeper issue is often how operational data is structured and connected.
SAP-sponsored research conducted by GigaOm found that 39% of organizations say data silos actively prevent real-time decision-making. Only 45% have full visibility into their data assets. The same research found that data-mature organizations are 1.8 times more likely to generate revenue growth from data-driven insights.
The advantage does not come from collecting data alone. It comes from making data usable within real decisions.
For example, leaders monitoring order fulfillment need more than a monthly figure for average delivery time. They need to identify which orders are at risk, what stage each order has reached, which team owns the next step, and whether similar delays are forming elsewhere. This level of visibility allows managers to intervene while the outcome can still be changed.
Three elements are central to this approach.
First, reporting must follow the end-to-end workflow. Departmental dashboards are useful, but they should connect to a shared view of how work moves across the business. A customer order should remain traceable from sales confirmation through fulfilment, invoicing, and payment.
Second, the organization needs consistent operational definitions. Terms such as “completed,” “approved,” or “on track” should have the same meaning across teams. Otherwise, consolidated enterprise reporting combines figures that describe different realities.
Third, visibility should lead directly to action. A delayed task should have an owner. An approval threshold should trigger the correct workflow. An exception should appear before it becomes part of a retrospective report. This turns operational data into a management system rather than a passive archive.
This is where connected operational platforms become valuable. Twendee helps businesses connect workflows, reporting, and business data across ERP, CRM, and internal systems. The aim is to create a shared operational view in which leaders can see current status, ownership, bottlenecks, and cross-department dependencies without manually combining updates from separate tools.
The most effective implementation usually begins with a business-critical workflow rather than a broad dashboard project. By identifying where decisions are delayed and which data is required at each stage, organizations can build visibility around actual operational needs. The resulting platform becomes easier for teams to use because it reflects how the work is performed.
Operational Visibility Is a Leadership Responsibility
Operational visibility is often treated as a technology or data-team initiative. However, many of its most important decisions sit with leadership.
Technology teams can integrate systems and improve data access. They cannot independently decide which workflows matter most, who should own cross-functional handoffs, or what level of delay is acceptable. These are operating-model decisions.
Leaders also determine whether departments optimize for local performance or shared business outcomes. A function may reach its own target while creating delays for another team. Without end-to-end accountability, departmental metrics can improve while the customer experience or overall process becomes slower.
The growing use of AI makes this responsibility more urgent. In the 2025 Process Optimization Report, Celonis found that 89% of surveyed leaders believe AI needs to understand how their business processes operate to deliver effective results. Meanwhile, 58% worry that weaknesses in existing processes could limit AI’s contribution.
AI cannot compensate for unclear ownership or fragmented workflows. If operational systems do not show which data is authoritative, which rules apply, and what actions are permitted, automation may simply execute an unclear process faster. This shift is already visible in customer service, where businesses are moving from standalone conversational tools toward AI systems that can retrieve operational data, understand workflow context, and support actions across teams. As explored in Customer Support Teams Are Moving Beyond Chatbots, the value of AI increases when it is connected to real processes, permissions, and reliable business data.
Leadership should therefore define a small set of operational priorities. Which workflows have the greatest impact on revenue, cost, risk, or customer delivery? Where do decisions repeatedly wait for information? Which handoffs lack clear ownership? Which reports arrive too late to influence the outcome?
These questions create a stronger foundation for both operational improvement and future automation. They also shift visibility from a reporting exercise into a leadership capability.
Conclusion
The challenge facing leaders is rarely a complete lack of data. The real issue is that operational information is often distributed across systems, teams, and reports that do not show how work connects.
Strong operational visibility gives leaders a current view of workflow progress, ownership, bottlenecks, and business impact. It allows teams to act before delays become missed targets and helps management distinguish isolated incidents from structural process problems.
Twendee works with businesses to build integrated operational platforms that connect workflows, reporting, and data across departments. By designing the platform around real processes and decisions, organizations can replace fragmented updates with a more consistent and actionable operational view.
Twendee helps businesses build that foundation through customer service AI agents connected to CRM, ticketing, and workflow systems. To explore how Twendee can support AI ticket routing, escalation design, and practical support automation, visit the Twendee website, follow Twendee on LinkedIn, or book a conversation through Twendee’s Calendly.