

Cloud applications can be available and still perform poorly. A system may show green uptime, while users experience slow responses, delayed workflows, rising infrastructure cost or unstable performance during peak traffic.
That is why cloud observability needs to move beyond infrastructure health checks. Modern applications run across cloud services, APIs, databases, containers, queues and third-party systems. Teams need to understand which workload creates pressure, why performance changes and how cost moves with usage.
For enterprises running AI, data and dynamic application workloads, observability is becoming a decision layer, not only a monitoring function.
Uptime no longer explains whether a cloud system is healthy
Traditional monitoring often starts with a simple question: is the system up or down? That view still matters, but it is too narrow for modern cloud applications.
A customer portal may be online, but checkout takes eight seconds. A dashboard may load, but the data pipeline behind it is delayed. An API may return successful responses, while latency increases enough to slow an entire workflow. A cloud database may stay available, while inefficient queries drive up cost every day.
In these cases, uptime does not show the real user or business impact.
Cloud observability gives teams a deeper view into how applications behave in production. It connects logs, metrics, traces, events and user experience signals so engineering teams can understand what happened, where it happened and which workload was affected.
The shift matters because cloud environments are more distributed than traditional infrastructure. One business transaction may pass through a web application, API gateway, authentication service, database, queue, storage layer, payment provider and analytics pipeline. When something slows down, a simple server-level alert may not identify the real cause.
A stronger observability setup should answer questions such as:
Which service created the latency?
Which API call failed or slowed down?
Which database query caused pressure?
Which customer-facing workflow was affected?
Which deployment, region or workload changed behavior?
Which cost increase came from real demand and which came from inefficiency?
This is the difference between “the system is running” and “the business workflow is working as expected.”
AI and data workloads make cloud behavior harder to predict
Cloud observability becomes more important when workloads are less predictable. AI, analytics and data-heavy applications can create uneven demand across compute, storage, network, database and model inference.
A chatbot may trigger many model calls during a customer support spike. A recommendation system may process more data after a campaign. A reporting workflow may create heavy database load at the end of the month. An AI agent may call APIs, tools and databases repeatedly to complete one task.
These patterns make cloud behavior harder to understand from infrastructure metrics alone.
Gartner forecasts that worldwide spending on AI-optimized infrastructure as a service will grow 96% in 2026, reaching $42 billion. Gartner also expects inference spending to reach $23.3 billion, exceeding training spending at $19 billion for the first time.
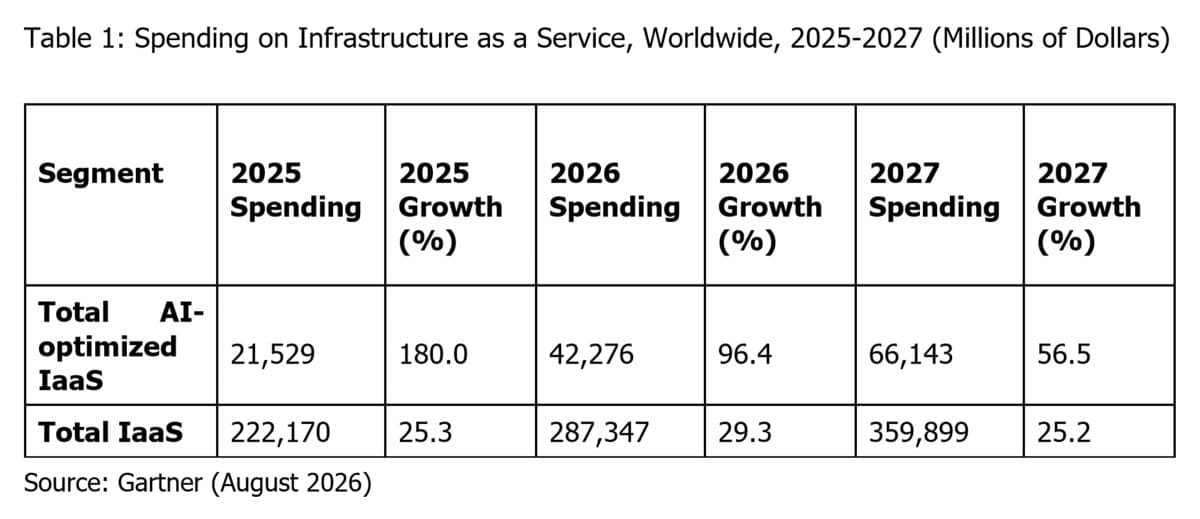
Gartner forecasts AI-optimized IaaS spending to grow from $21.5B in 2025 to $42.3B in 2026 and $66.1B in 2027, showing why cloud teams need stronger visibility into workload behavior, cost drivers and performance pressure as AI infrastructure expands. (Source: Gartner)
That shift is important for observability. Training is often planned as a large technical workload. Inference happens continuously inside real applications: chatbots, recommendation systems, fraud detection, copilots, AI agents and industry-specific workflows. As inference moves closer to daily operations, teams need visibility into latency, throughput, cost and failure points.
Cloud observability should therefore track more than infrastructure utilization. It should connect performance signals to the workload that created them.
For example:
A customer support AI assistant may look slow because the model is slow, the retrieval layer is overloaded or the CRM API is taking too long.
A finance dashboard may become expensive because queries scan too much data, refresh too often or run during peak hours.
An AI workflow may create cost spikes because it retries failed tool calls or sends long context repeatedly.
Without workload-level observability, teams may add more cloud capacity when the real issue is architecture, data access or workflow design.
Cost, latency and throughput need to be viewed together
A common mistake is treating cloud cost, application performance and infrastructure monitoring as separate conversations. In production, they are connected.
A system can reduce cost by lowering capacity, then create latency problems. A team can improve speed by adding resources, then increase spend without knowing which workflow needed that capacity. A database can stay within CPU limits, while one inefficient query drives slow response time and higher usage cost.
Cloud observability should bring these signals together:
Latency: how long users or systems wait for a response.
Throughput: how much work the system handles over time.
Error rate: where requests fail, retry or timeout.
Resource usage: how compute, memory, storage and network behave.
Cost drivers: which workloads, services or teams create spend.
Business impact: which workflow, customer group or product area is affected.
Datadog’s State of Cloud Costs research focuses on cloud cost patterns across services such as compute, containers, serverless, databases and AI workloads, showing why cost analysis increasingly needs service-level and workload-level visibility rather than a single cloud bill view.
Datadog also notes that its cost recommendations combine billing and observability data to identify concrete ways to reduce spend, including resource resizing and storage-class changes. In its earlier cloud cost research, Datadog found that more than 80% of container spend was wasted on idle resources.
That number illustrates a useful point: cloud waste is not always visible in a bill alone. Teams need to see whether resources are supporting real workload demand or sitting idle because capacity, scaling rules or architecture were poorly designed.
For Twendee, this is why observability work should connect engineering signals with business context. A dashboard that shows CPU usage is useful. A dashboard that shows which application workflow increased cost, slowed response time and affected users is more valuable.
Observability should show which workload creates pressure
Modern cloud systems often fail gradually before they fail visibly. Latency rises. Queue depth increases. Database response slows. Error retries grow. Costs drift upward. Users may feel the issue before the monitoring system shows a critical incident.
A workload-focused observability model helps teams catch these signals earlier.
Instead of only tracking servers, teams should map observability to actual workloads:
Checkout flow
Payment processing
Customer support workflow
Data synchronization
Report generation
Inventory update
AI model inference
Internal approval process
ERP or CRM integration flow
This approach helps teams answer a more useful question: which business flow is under pressure?
Grafana Labs’ 2025 observability survey, based on 1,255 responses, found that larger organizations use more data sources, with companies above 5,000 employees averaging 24 data sources, compared with 6 for companies with 10 or fewer employees.
That complexity affects troubleshooting. More systems generate more signals, but more signals do not automatically create better decisions. If logs, metrics and traces are not organized around workloads, teams can spend hours reading technical data without understanding the operational impact.
A good observability layer should help teams see:
Which workflow is affected.
Which service or dependency created the issue.
Whether the problem is latency, cost, throughput or reliability.
Whether the issue came from user demand, code change, data growth or infrastructure limits.
Which team owns the fix.
This is the point where observability becomes operationally useful. It gives teams a shared view of what is happening across applications, data flows and cloud resources.
Better observability reduces incident cost and response time
Cloud incidents can become expensive quickly because downtime and degraded performance affect revenue, customer experience and internal productivity.
New Relic’s 2025 Observability Forecast found that the median outage cost per hour for high-business-impact outages was $1 million for organizations with full-stack observability, compared with $2 million for those without it.
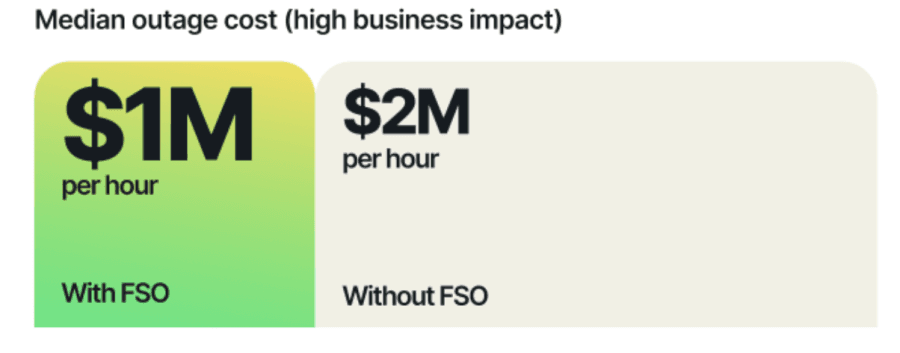
New Relic’s 2025 Observability Forecast shows that organizations with full-stack observability report a median high-business-impact outage cost of $1M per hour, compared with $2M per hour for organizations without it. (Source: New Relic)
The exact impact will vary by business, but the direction is clear. Teams with stronger observability can detect issues earlier, understand dependencies faster and reduce the time spent guessing where the problem sits.
For cloud teams, the goal is not to collect every possible signal. The goal is to collect the signals that shorten the path from incident to explanation.
A useful incident view should show:
What changed recently.
Which users or workflows are affected.
Which dependency is slow or failing.
Whether the issue is local or system-wide.
Whether the same pattern happened before.
Which service owner should respond.
This matters for AI-enabled systems as well. When an AI assistant, agent or analytics workflow becomes slow or expensive, teams need to know whether the issue came from model latency, data retrieval, API calls, database queries, prompt length, tool errors or cloud capacity.
Without that visibility, teams may overcorrect by adding more infrastructure or rolling back the wrong component.
Cloud observability should support architecture decisions
Observability is often treated as a post-deployment concern. Teams build the system, launch it, then add monitoring. That approach limits the value of observability because the most important signals are often tied to architecture.
A strong cloud architecture should define observability from the start:
Which workloads need traceability?
Which services must be measured by latency and cost?
Which user journeys are business-critical?
Which dependencies need service-level alerts?
Which cost signals should be tied to product, team or customer segment?
Which dashboards matter to engineering, operations and business leaders?
This is especially important when companies scale AI, data platforms or real-time applications. More capacity may hide performance issues for a while, but it does not fix inefficient workflows, fragmented data flows or poor service boundaries.
Twendee’s role in this area is practical. We help teams design cloud monitoring and observability layers for applications, connect performance, usage and cost signals to real workloads, and identify bottlenecks before cloud resources are scaled blindly.
For example, instead of only showing that database usage increased, an observability layer should show which application feature, API flow or reporting job created the increase. Instead of only showing that cost rose, it should show whether the increase came from real user growth, inefficient queries, oversized resources or repeated background jobs.
That level of visibility makes cloud decisions more objective.
Conclusion
Cloud observability is no longer only about uptime, error logs or infrastructure dashboards. Modern cloud systems need visibility into cost, latency, throughput and workload behavior because application performance and cloud spend now move together.
As AI, data and dynamic workloads expand, enterprises need to know which workflows create pressure and which architecture decisions drive cost or performance risk.
Twendee helps businesses build observability layers that connect technical signals with real workloads, so teams can improve reliability, control cloud cost and scale applications with better evidence.
Book a call: Calendly
Read our latest blog: Multi-Cloud Strategy Is Back on the Agenda as AI Infrastructure Expands
SEO Information
Meta title: Cloud Observability for Cost and Workload Visibility
Meta description: Cloud observability should track cost, latency, throughput and workload behavior so teams can identify cloud bottlenecks before scaling resources blindly.
Suggested slug: cloud-observability-cost-latency-workload
Primary keyword: cloud observability
Secondary keywords: cloud monitoring, application observability, infrastructure monitoring, workload monitoring, cloud performance monitoring
